Exploded view

The weather, in four layers map, halo, rain, lightning

When you open Rain Radar before a bike ride or partway through a walk, you are looking at four things drawn one on top of the other. Here we pull them apart, one by one, to see what each of them is telling you. All of it is real: an actual stormy evening over France, taken straight out of the app.

View

Layers

Hover a name to isolate its layer. Drag the model to turn and tilt it.

The map where you are
The halo the damp air
The rain falling now
The weather rain and halo
The lightning strike by strike

The four layers

What each one tells you

They answer different questions. Where am I? How big is that rain cell, really? Is it raining on me right now, and how hard? And would I rather not be outdoors for the next few minutes?

The map

Towns, roads and coastline, so you can find your own street under the weather. It stays underneath and holds still: it is the weather that slides over the top as you scrub through time.

  • Comes fromOpenStreetMap
  • CoversFrance and Corsica
  • Updatedcontinuously

The halo

A soft veil around each rain cell, hinting at the damp air the radar picks up before anything reaches the ground. Take it as a sense of how big the cell really is and which way its edge is spreading: not as a measurement to rely on.

  • Showshow far the cell reaches
  • Refreshedevery 5 min
  • Read it asan impression

The rain

The one that matters: where rain is actually falling, and how hard. Blue is light, yellow and orange will soak you quickly, red is a violent downpour. This is the layer you scrub through with the time slider, and the one the alerts watch.

  • Showsrain, right now
  • Refreshedevery 5 min
  • Archived90 days

The lightning

Every cyan cross is a real strike. They are picked up by a worldwide network of volunteers running small radio receivers at home, and reach the app a few seconds after the flash. Each frame shows only the strikes from its own minutes.

  • Showswhere it struck
  • Arrives inseconds
  • On this frame

Reading the colours

Is it raining hard, or not?

The rain layer is coloured by how much water is falling, in millimetres per hour. You don’t need to remember the numbers: the step from blue to yellow is where “a bit damp” turns into “time to take cover”.

BlueDrizzle to steady rain. A jacket will do.

YellowHard enough to soak you in a few minutes.

OrangeA proper downpour. Puddles form fast.

Red and pinkA deluge, often with the lightning to match.

Where the images come from

Thirty-nine radars, one image every five minutes

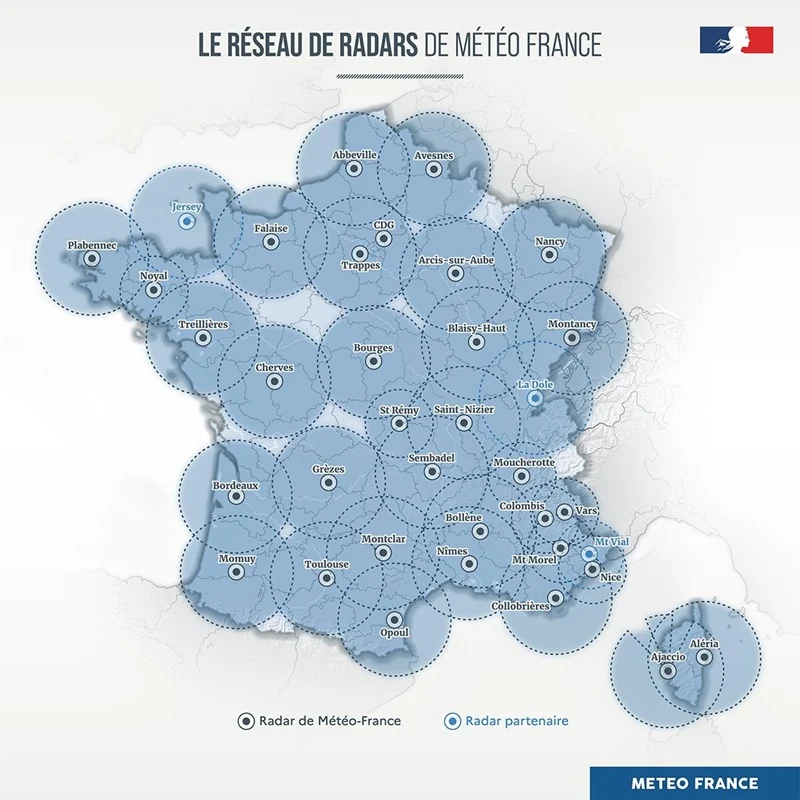
The rain layer doesn’t come out of nowhere, and Rain Radar does not make it up. It comes from the Météo-France radar network — thirty-nine of them in all — whose antennas turn day and night. The app’s five-minute refresh isn’t a choice of ours: it is the rhythm of the network.

Map of France dotted with named radar sites — Trappes, Bourges, Toulouse, Nancy… — each at the centre of a disc standing for the area it watches. The discs overlap and cover the whole country, Corsica included. A few sites, in light blue, are marked as partner radars: Jersey, La Dole, Nice, Mont Vial.
The mainland network, partner radars included. Map: Météo-France.
  1. 01

    The radar turns

    Each antenna sweeps the horizon and slices the sky around it into 720 wedges half a degree wide. One radar on its own only sees its own region: on the map, that is a disc — not France.

  2. 02

    The views are stitched together

    The discs overlap, and a few partner radars — Jersey, La Dole, Nice, Mont Vial — fill the gaps near the borders. Météo-France assembles the lot into a single image of the whole country: a mosaic. That image, and not one image per radar, is what the app receives.

  3. 03

    The fallen water is counted

    The mosaic doesn’t give a rate but an amount: the water that fell during those five minutes, counted to the hundredth of a millimetre. Every point in the country gets its own number.

  4. 04

    Rain Radar colours it in

    We multiply by twelve to get back to millimetres per hour — the unit of the scale above — then apply the colours and cut the image into tiles. No colour is invented: each one stands for a measured number.

Sources: Météo-France, “Les systèmes d’observation” · AERIS, “Réseau de radars de Météo-France”

Now you know what you are looking at.

Four layers, one map